Python Air Quality Tutorial
| Use OpenAQ’s free API to get air quality data using Python |
|---|
For this tutorial we will use Python to query the OpenAQ REST API. To make HTTP requests we will use the popular requests library. Any other HTTP library will work, e.g. httpx or even the standard library urllib
OpenAQ maintains a REST API at https://api.openaq.org which provides programmatic access to the OpenAQ database. The API returns results in JSON, a standard format for REST APIs.
📝 - Remember your libraries.
import pandas as pd, requests, json
How to find locations in a specific area
Finding locations by country
To query by country use the ISO 3166-1 alpha-2 two letter code and the country query parameter. The ISO 3166-1 alpha-2 code for Portugal is ‘PT’
country = 'pt'
url = f'https://api.openaq.org/v2/locations?country={country}'
response = requests.get(url)
response.url
https://api.openaq.org/v2/locations?country=ptThis is the url. 💡 You can paste this in your browser and see the data that way as well.
data = response.json()
data['results']
data.keys() will tell us the json keys are ‘meta’ and ‘results’. The sensor data is in ‘results’.
Finding locations by City
If we are interested in finding locations in a more specific geographic area, such as a city, we can utilize the city parameter: city=. To ensure we are searching the correct city, it is best to combine city and country for specificity. e.g. There is London in the United Kingdom and London, Ontario, Canada. Simply using city=London would return locations for both Londons and any other London in the OpenAQ database.
city = 'Lisboa'
url = f'https://api.openaq.org/v2/locations?country={country}&city={city}'
lisboa_response = requests.get(url)
lisboa_data = lisboa_response.json()
len(lisboa_data['results'])
This will print the number of sensors that returned data from our API request. To see the data
lisboa_data['results']
Filter by Pollutants (parameters)
The previous query includes locations regardless of the types of parameters. Lets add to our query and narrow the results to one parameter.
A complete list of parameters supported in the OpenAQ platform can be found at https://api/openaq.org/v2/parameters
parameter_name = 'co'
url = f'https://api.openaq.org/v2/locations?country={country}&city={city}¶meter={parameter_name}'
one_parameter_response = requests.get(url)
one_parameter_data = one_parameter_response.json()
one_parameter_data['results'][0] #look at data from the first sensor listed
Filter locations by sensor type (reference grade vs low-cost sensor)
We can also filter our results to only include the sensor type we want. Reference grade sensors are more accurate, but there are fewer of them. Low-cost sensors have better coverage around the world. However there is one problem, url addresses do not work with white spaces, like the space in ‘reference grade’. Luckily, the requests.get method can handle that for us. We will change the way we do our query so we do not have to url encode the string ourselves.
#Lets define our query parameters...
params = {
	'country': 'PT',
	'city': 'Lisboa',
	'sensorType': 'reference grade', # 'reference grade' or 'low-cost sensor'
	'limit': 10 # you can limit the results
}
This time we will just use the endpoint as the url, and the requests module will attach our query parameters for us. We will pass params to the requests.get method as params=params
base_url = 'https://api.openaq.org/v2/locations'
response = requests.get(base_url, params=params)
reference_grade_only = response.json()['results']
Get a list of sensor locations for an area
params = {
	'country': 'PT', # country code
	'city': 'Lisboa',
	'parameter': 'pm25' # If you want to narrow it down
}
url = 'https://api.openaq.org/v2/locations'
response = requests.get(url, params=params)
data = response.json()
data['results']

#make a list
locations = [{ "name": location["name"],"location_id": location["id"]} for location in data['results']]

locations
How to get measurements for a specific location
Now you have a list of of sensor locations in the area you want, and their associated ID numbers. Let plug one in and use start and end dates shall we?
Dates must be in the ISO-8601 date time + offset format e.g.
2000-01-01T00:00:00+00:00, which is January 1 2000 12:00 AM at UTC. Let’s define our query parameters as we did before.
params = {
	'location_id': 68357,
	'date_from': '2022-08-01T00:00:00+00:00',
	'date_to': '2022-08-01',  # will default to UTC
	'limit': 2000
}

base_url = 'https://api.openaq.org/v2/measurements'
response = requests.get(base_url, params=params)
our_location_data = response.json()
our_location_data
💡 Use list comprehension to turn json into a dictionary. The desired keys will become columns and their values will be rows.
measurements = [{"date": row['date']['local'], "value":row['value'], "parameter":row["parameter"], "unit":row["unit"]} for row in our_location_data['results']]
💡 Now we can make a dataframe, which will make the data easier to plot.
df = pd.DataFrame.from_dict(measurements)
df['parameter'].value_counts() #see how much different pollutant data we have
df['date'] = pd.to_datetime(df['date']) # turn data strings into datetime objs
Lets create a chart for one parameter (pm25). First we will make a new dataframe that only has pm25 as a parameter. Then we will set the index to the timestamp. Plots will chart the index on the x axis by default.
pm25 = df[df['parameter']=='pm25']
pm25.set_index('date', inplace=True)
pm25.head(3)
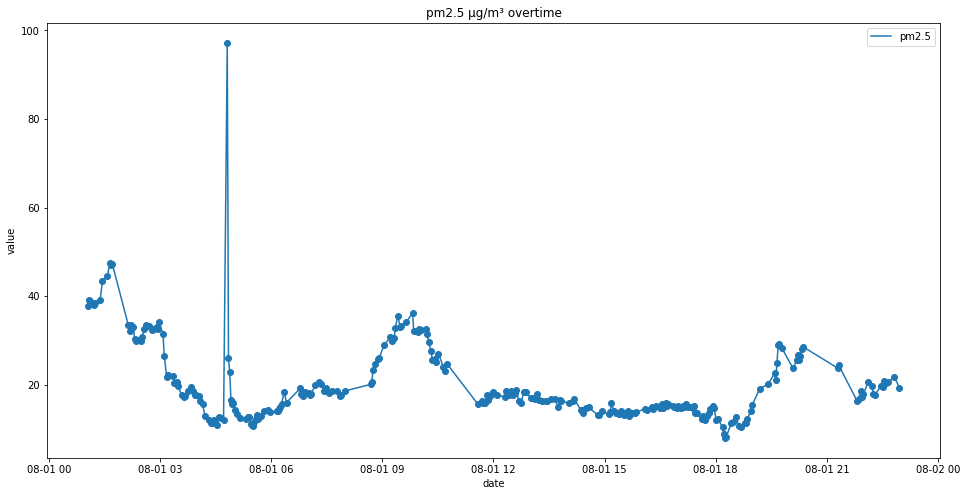
Lets plot the chart. By default, the plot will use the index (we set as the date) as the x axis, and numeric data as the y axis.
plt.figure(figsize=[16,8]) #set the size of the chart
plt.plot(pm25.index, pm25['value']) # same for pm25
plt.scatter(pm25.index, pm25['value'])
plt.legend(['pm2.5']) # make a lengend so we know what the colors mean
plt.xlabel('date')
plt.ylabel('value')
plt.title('pm2.5 µg/m³ overtime')
plt.show()
You should get a nice looking chart like this!
I hope this helped you start using OpenAQ’s API with Python 👍 Have a blessed day and breathe clean air!
